Kensa Health launches free SPC library for healthcare analysts
Kensa Health has developed spc-lib-py, a free, open-source Python statistical process control (SPC) library for healthcare analysts.
Built around NHS England’s Making Data Count approach, it helps healthcare analysts understand variation, identify changes worth investigating and assess whether a process can consistently meet its target.
The library is designed to make SPC simpler to use within existing analytical workflows. For clinical, operational and commissioning colleagues, the results can help explain changes in performance and support discussions about where to investigate.
Making SPC analysis simpler
Healthcare performance figures move from month to month, but an increase or decrease doesn’t always mean something has changed. SPC charts help analysts distinguish routine variation from patterns that warrant closer attention.
With spc-lib-py, one call turns a pandas DataFrame into process limits, special-cause signals and target assurance. Analysts can plot the results or export them as JSON for their own applications.
The library includes 11 control chart types, alongside Bernoulli CUSUM and Pareto tools for monitoring individual outcomes and identifying the biggest contributors to a problem. Analysts can compare sites or teams, rebase at a known service change, fix limits using a baseline period and supply seasonal expected values.
Bringing these functions together reduces the work involved in setting up the analysis. Analysts can spend more time interpreting the findings and discussing possible explanations with colleagues who know the service. This connection between analysis and service decisions is explored further in How Analysts Can Support Strategic Commissioning Through Actionable Intelligence.
What an SPC chart can tell you
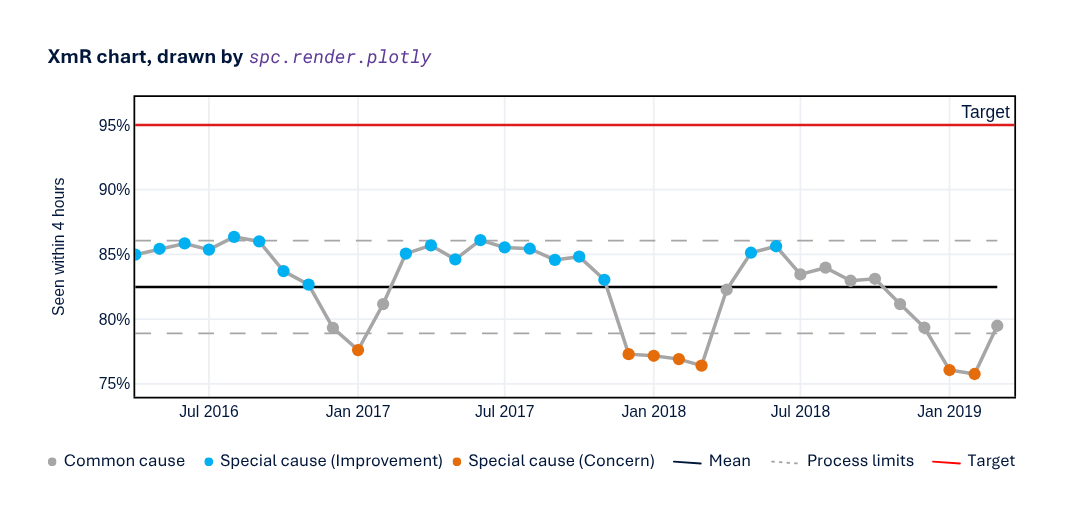
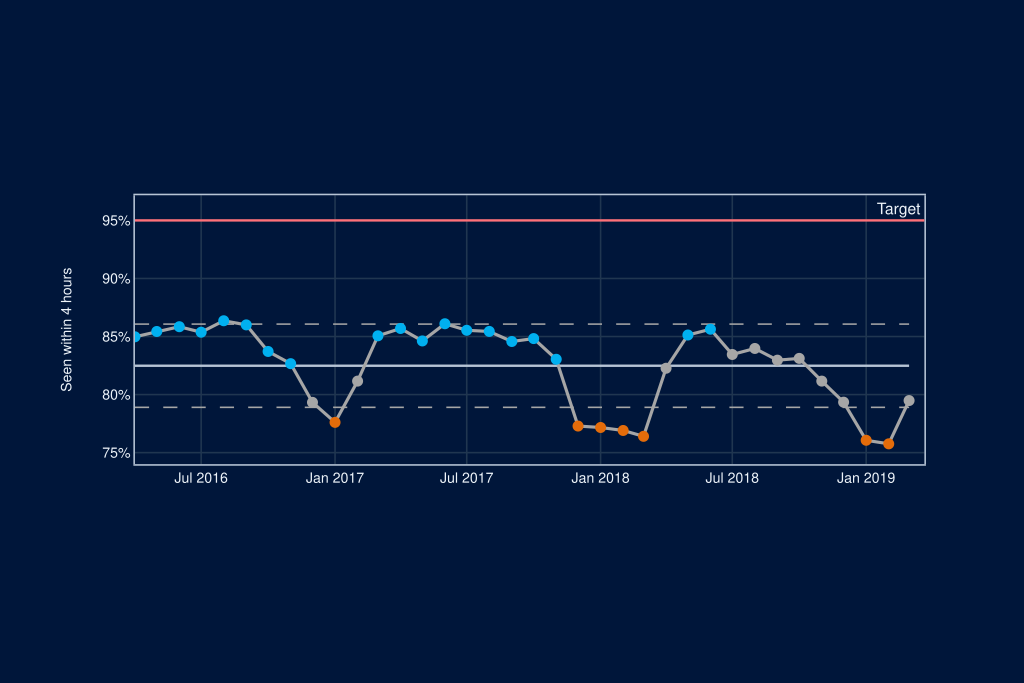
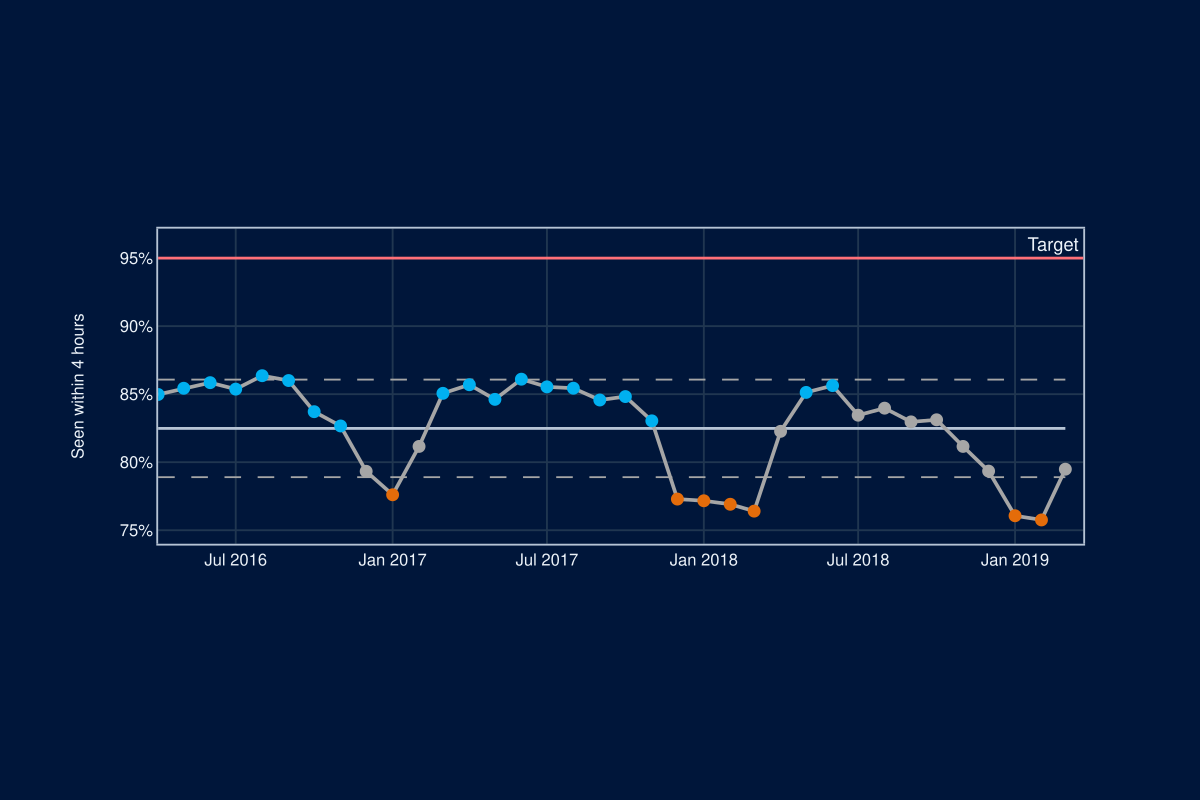
This historical A&E example shows the percentage of Type 1 attendances completed within four hours between April 2016 and March 2019. The 95% target sits above the upper process limit.
That matters because it indicates that the current process cannot consistently deliver the target. Meeting it requires a change in the process, rather than expecting routine month-to-month variation to produce a different result.
SPC helps make that distinction visible. Understanding what needs to change still depends on analysts’ interpretation and the knowledge of the teams delivering the service.
Source: NHSRdatasets. A flat mean baseline is used for illustration; operational analysis should account for seasonality where appropriate.
For a separate example of how wider pathway analysis can inform improvement planning, read Fixing Flow Beyond the Emergency Department Front Door. This case study explores how Health Insights helped NHS South East investigate the relationship between admitted patient flow and emergency department capacity.
Explore the free Python SPC library
spc-lib-py is available under the MIT licence and works with Python 3.11 or later. Its core dependencies are numpy, pandas and pydantic, with Plotly available as an optional extra for creating charts.
Analysts and developers are welcome to explore the code, try the library, raise issues and contribute improvements. As an early release, its API may still change.
If your analytical colleagues use Python or are developing SPC reporting, the library may be a useful resource to share.
View the free Python SPC library on GitHub
Have a bigger question to answer?
For teams working across linked datasets or looking to apply SPC at scale, Kensa Health’s Intelligence capability supports wider analysis of healthcare performance, future demand and the potential impact of service changes.
To discuss your analytical priorities, contact us today.
spc-lib-py follows NHS England’s Making Data Count approach and is not endorsed by NHS England.