
The NHS Has Data, But How Do We Transform It Into Insight?
Spend time inside any NHS organisation and one thing becomes clear very quickly. There is no shortage of data. Dashboards exist at every level, reports are produced constantly, and teams invest significant effort in analysis. Yet despite this, many leaders and operational teams still struggle to answer a small set of critical questions with confidence.
What is happening right now across the system, not just in one service?
Why is performance changing?What is likely to happen next?
And most importantly, what should we do about it?
The gap is not access to data. The gap is the ability to turn that data into decisions that can be acted on in real time.
This is the problem Kensa Analytics was built to solve.
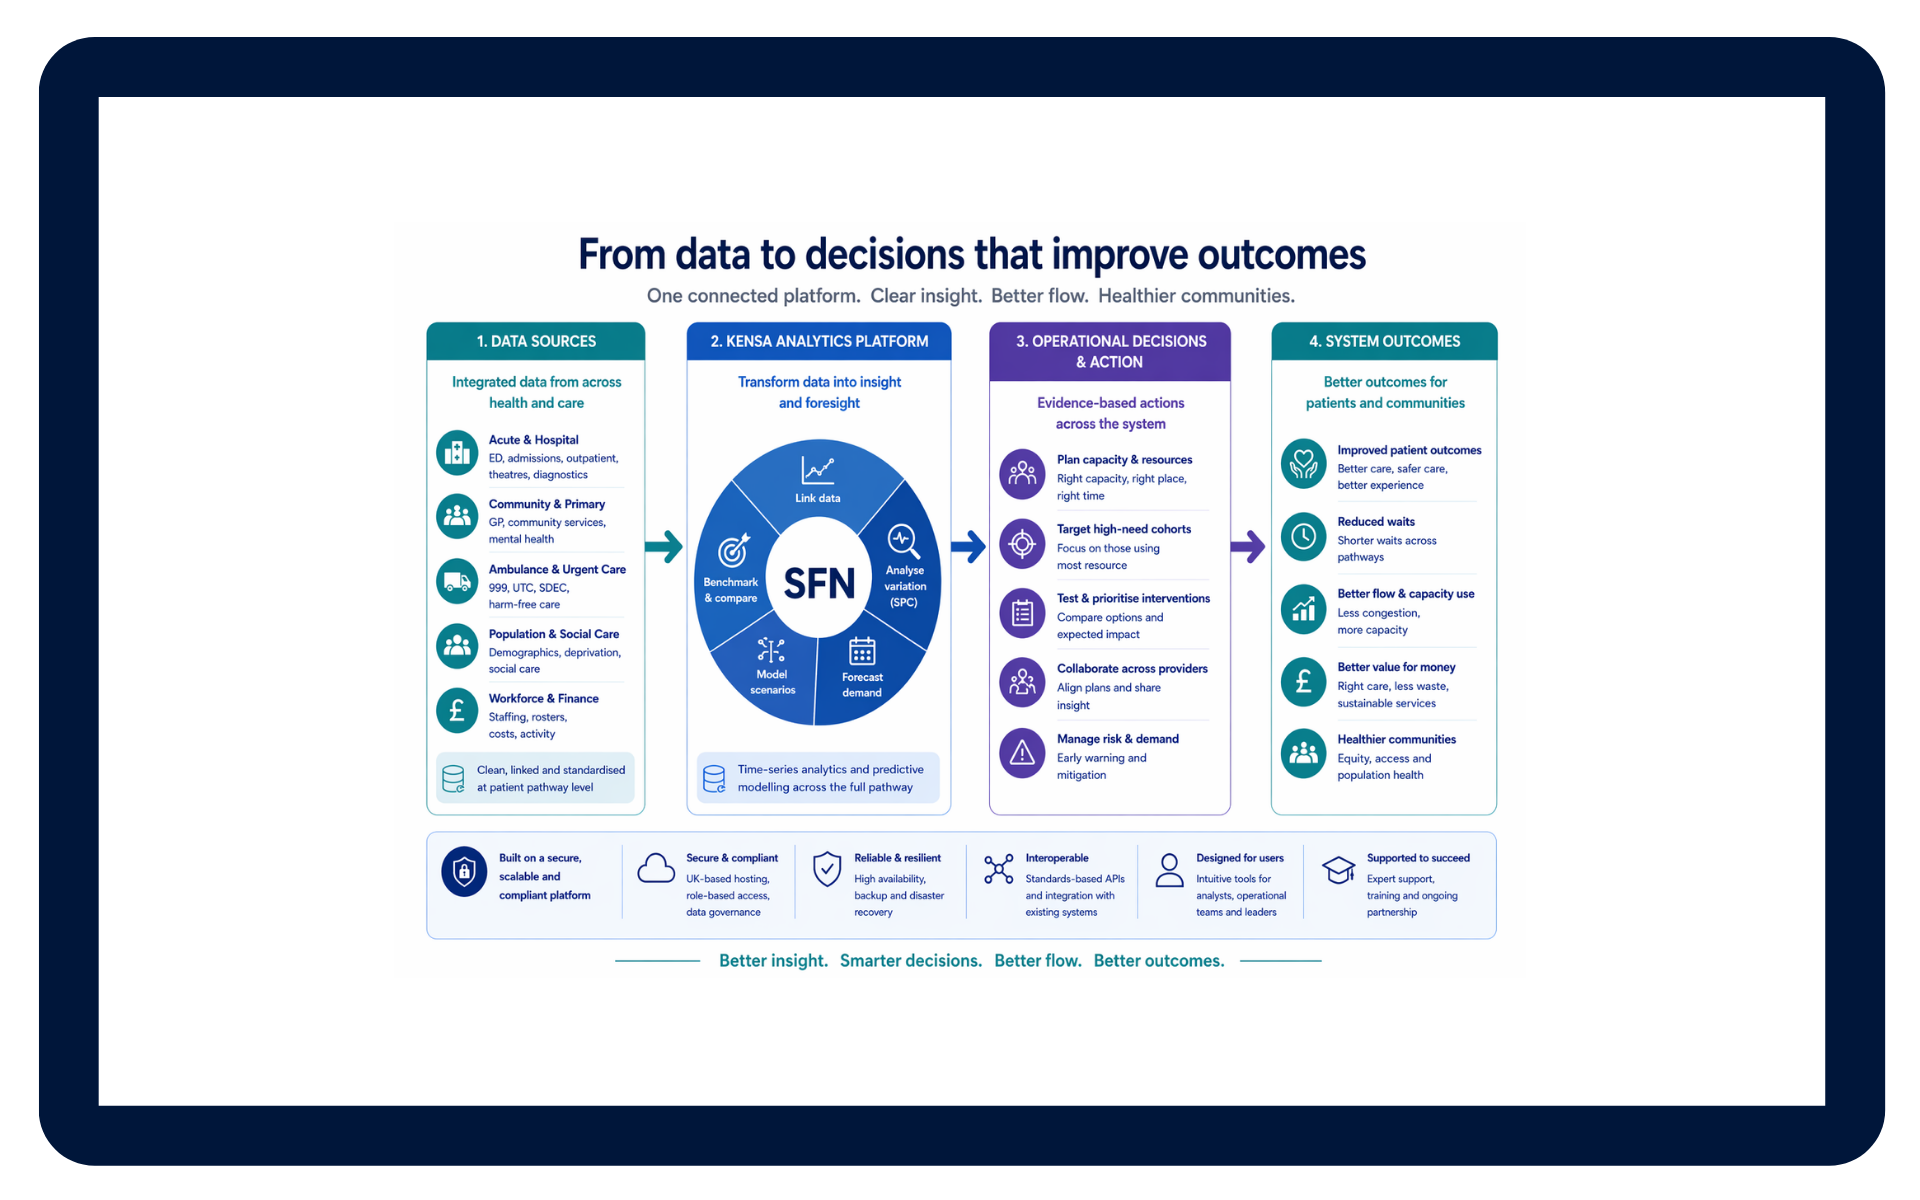
Kensa Analytics is a system-level decision platform designed for the NHS. It connects data across the full patient pathway, applies a consistent analytical method, and gives leaders the ability to understand, predict, and change system performance as it happens. The aim is simple. Move organisations away from looking backwards and towards actively managing what happens next.
Across Integrated Care Boards and providers, the same pattern tends to repeat. Data sits in silos across organisations and services. Reporting is often retrospective and static. Analysis varies depending on who is producing it. Insight arrives after the moment to act has already passed. Planning, in many cases, is still built on assumptions rather than evidence.
Over time, this creates real operational risk. Variation is not fully understood or managed. Demand and capacity drift out of balance. Investment decisions become harder to justify. Transformation programmes start with intent but struggle to deliver the outcomes expected of them.
Traditional analytics plays a role in understanding the past. It is far less effective when the task is to influence what happens next.
Kensa Analytics takes a different approach by focusing on decision-making rather than reporting. That approach is built on five capabilities that work together as a single system.
First, data is linked across the full patient pathway. Instead of viewing services in isolation, datasets are connected across providers and settings to reconstruct the patient journey end to end. This creates a true system view, where interactions between services become visible and measurable.
Second, a standardised analytical method is applied. Statistical Process Control is used consistently across the system, with common definitions and logic. This removes the variation that comes from different teams interpreting data in different ways and gives leaders a version of the truth they can trust.
Third, analytics is brought into real time. Rather than relying on monthly reports, teams can access continuous insight and use it at the point decisions are made. This changes the role of analytics from something that explains performance after the fact to something that actively supports operational control.
Fourth, forecasting provides forward visibility. Time series modelling is used to show where performance is heading based on current demand and flow. This allows teams to see trajectory early and plan with greater confidence.
Finally, counterfactual and scenario modelling allow organisations to test change before committing to it. By defining a “do nothing” baseline and modelling the impact of interventions, teams can quantify expected outcomes and understand the trade-offs involved.
Taken together, this represents a shift away from hindsight and towards foresight and control.
The impact of that shift becomes clear when looking at urgent and emergency care. Many organisations understandably focus their attention on the emergency department front door. However, the underlying issue is usually flow across the first 72 hours of the pathway. A relatively small proportion of patients can consume a disproportionate amount of capacity. Delays in one part of the pathway compound into pressure elsewhere, often without being fully visible.
Using a system-wide view, it becomes possible to see where demand is actually concentrated, how capacity is being used, and what is likely to happen if nothing changes. It also becomes possible to test interventions in advance and understand which actions will have the greatest impact on flow. This allows teams to improve the system itself rather than continually responding to symptoms.
The same principles apply across planned care, population health, and system planning more broadly. In each case, the challenge is not simply understanding performance, but shaping it.
Underpinning this approach is the sfn platform, which applies time series analytics, Statistical Process Control, and modelling to linked healthcare data. It enables users to understand why the system is performing as it is, what is likely to happen if current patterns continue, and what needs to change to achieve a different outcome. Importantly, it is designed to be used not only by analysts, but also by operational and clinical teams who need to make decisions day to day.
For system leaders, this creates a clearer line of sight between population need, investment decisions, and outcomes. It becomes easier to target high-need cohorts, to understand variation across providers, and to support the shift of care closer to home.
For providers, it supports better flow, more effective use of beds and workforce, and more predictable performance. For patients, it translates into faster access to care, more appropriate care settings, and improved outcomes.
Statistical Process Control is already widely used across the NHS. In many cases, however, it sits within static dashboards and is used to describe what has already happened. The opportunity is to move beyond that and use the same principles in real time, at system level, to support decisions as they are made.
That is where Kensa Analytics is focused. Not on adding more data, but on making it possible to use the data that already exists to understand, predict, and shape what happens next.


.webp)
